FreeStockCharts.com
Online Broker Review has gone to great lengths to thoroughly review the charts found at all of the top online brokers. Luckily, for those that have chosen a broker with less than adequate charts there are many free charting solutions. Most people are already familiar with the charts offered by Yahoo! Finance, Google Finance and BigCharts. Of the three we are partial to Yahoo! but we have come across an even better charting platform which we would like to share with our readers.
FreeStockCharts.com
Free Stock Charts is owned by Worden, the maker of financial software products TeleChart and StockFinder. At first glance, Free Stock Charts is exactly what one would expect - a free website with stock charts. It offers so much more than that though so let's take a look at some of the site features.
Getting Started
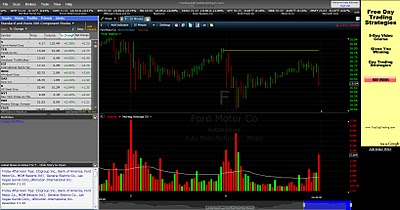
Free Stock Charts does not have a landing page - navigating to the site immediately loads the charting application. Note that you will have to download and install Microsoft Silverlight before you can use Free Stock Charts. The top toolbar allows users to load layouts, search for stock symbols, access helpful tutorials and log in to the site. Just below this toolbar is a scrolling stock ticker. The left panel contains lists of stocks by category, stock related news items, user definable portfolios, alerts, notes, social networking features and more. The center panel contains stock charts, indicators and other related tools. The right panel contains an advertisement which is always visible but never really gets in the way. Here is a look at the site's layout (click on images for larger views):
Creating Charts
Clicking on the top left corner of the chart pane brings up a text box to type in the stock symbol of your choice. If you do not know the symbol, simply type in the company name and the symbol should appear. From here, there are a plethora of customizations available. We will walk through some of the major features below.
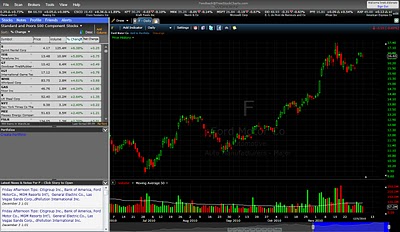
Plot styles available include candle stick, line, bar, area and a slight derivations thereof. Full customization of the colors of all plot styles is available. Here is a six month candle stick chart for Ford (F):
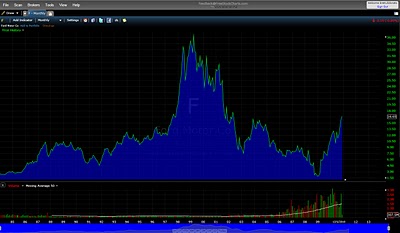
The stock ticker and left side bar can be removed to allow for even larger charts. We really appreciate being able to use the full real estate on our large wide screen monitor. Here is a full size long term area chart:
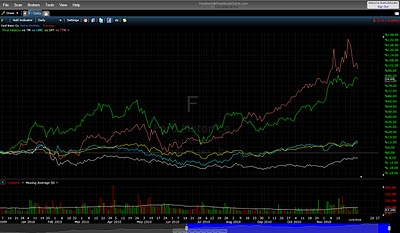
Up to six stocks and indices can be graphed on a single chart. Here is a comparison between five publicly traded automobile companies:
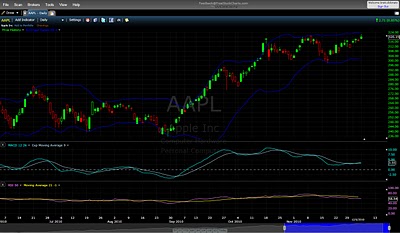
Free Stock Charts also features customizable technical indicators. In total we counted 69 different indicators. Here is a six month Apple (AAPL) candle stick chart with bollinger bands, MACD and RSI indicators:
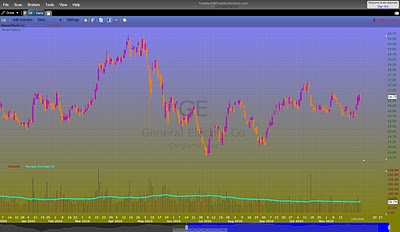
Almost all chart colors can be customized. Here is a one year chart of General Electric (GE) with some wild color choices:
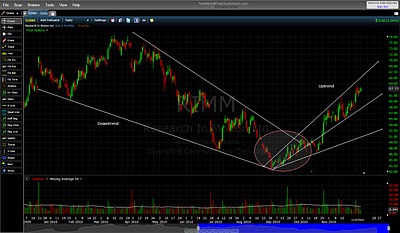
One of our favorite features is the large number of drawing tools available. Here is a one year chart of Research in Motion (RIMM) with trend lines, an ellipse and text notes:
We were so proud of our creation that we decided to save it. This can done by selecting File / Save Layout from the top toolbar. Once layouts are saved, they can be retrieved by selecting File / Load Layout and selecting the appropriate name. Layouts can be emailed as well by selecting File / Email Layout. The body of the email will simply contain a link to the Free Stock Charts website and load the layout. On feature we would love to see is a nice sized snapshot of our chart inserted in the body of the email as well.
Final Thoughts
FreeStockCharts.com offers one of the best charting experiences right in your web browser and rivals the top broker charting platforms offered by thinkorswim, E*TRADE and others. At first glance the tool may be intimidating to novice chartists but we think that the steep learning curve is well worth the investment.
If you have other free charting platforms that you would recommend then let us know by dropping a line in the comments of this article.
Related Articles:
Broker Charts Reviews


